Mind mapping and visual thinking tools transform how we process information, solve problems, and unleash creative potential in both personal and professional settings.
In today’s fast-paced digital world, our minds are constantly bombarded with information from multiple sources. Traditional linear note-taking and thinking methods often fall short when we need to process complex ideas, brainstorm innovative solutions, or organize thoughts effectively. This is where mind mapping and visual thinking tools come into play, offering a revolutionary approach to how we capture, organize, and connect information.
Visual thinking isn’t just a trendy productivity hack—it’s rooted in how our brains naturally process information. Research shows that the human brain processes visual information 60,000 times faster than text, making visual tools exceptionally powerful for learning, problem-solving, and creative exploration. By leveraging these tools, you can unlock cognitive capabilities that remain dormant when using traditional linear methods.
🧠 Understanding Mind Mapping: Your Brain’s Natural Language
Mind mapping is a visual thinking technique that mirrors the brain’s natural way of making associations and connections. Developed by Tony Buzan in the 1970s, this method uses a radial structure with a central idea branching out into related concepts, creating a tree-like diagram that reflects our neural pathways.
Unlike traditional note-taking that forces information into linear sequences, mind maps allow ideas to flow organically in multiple directions simultaneously. This approach activates both hemispheres of the brain—the logical left side and the creative right side—resulting in enhanced comprehension, retention, and innovation.
The basic structure of a mind map includes a central concept or question placed at the center, with main themes branching outward as thick lines. Sub-topics extend from these main branches, creating a hierarchical yet interconnected web of information. Colors, images, symbols, and keywords enhance memory encoding and make the map more engaging and memorable.
Why Mind Maps Outperform Traditional Note-Taking
When you create a mind map, you’re not just recording information—you’re actively processing and organizing it. This engagement leads to deeper understanding and better recall. Studies have shown that students using mind maps for studying demonstrate significantly improved test performance compared to those using conventional linear notes.
Mind maps also reveal relationships between concepts that might remain hidden in traditional formats. These connections often spark creative insights and innovative solutions, making mind mapping invaluable for brainstorming sessions, strategic planning, and problem-solving activities.
📱 Digital Mind Mapping Tools: Bringing Visual Thinking to Your Fingertips
While traditional pen-and-paper mind mapping remains effective, digital tools have revolutionized this practice by adding flexibility, collaboration features, and integration capabilities that paper simply cannot match.
Digital mind mapping applications allow you to easily reorganize branches, add unlimited detail through attached notes and files, collaborate in real-time with team members, and access your maps across all devices. These advantages make digital tools particularly valuable for professional projects and long-term knowledge management.
Popular mind mapping applications include MindMeister, XMind, Coggle, and MindNode, each offering unique features suited to different needs and preferences. Many of these platforms offer both free and premium versions, making visual thinking accessible to everyone from students to corporate teams.
🎨 Visual Thinking Beyond Mind Maps: Expanding Your Toolkit
While mind maps are powerful, they’re just one approach to visual thinking. Expanding your toolkit with complementary visual methods can address different thinking challenges and maximize your creative and analytical capabilities.
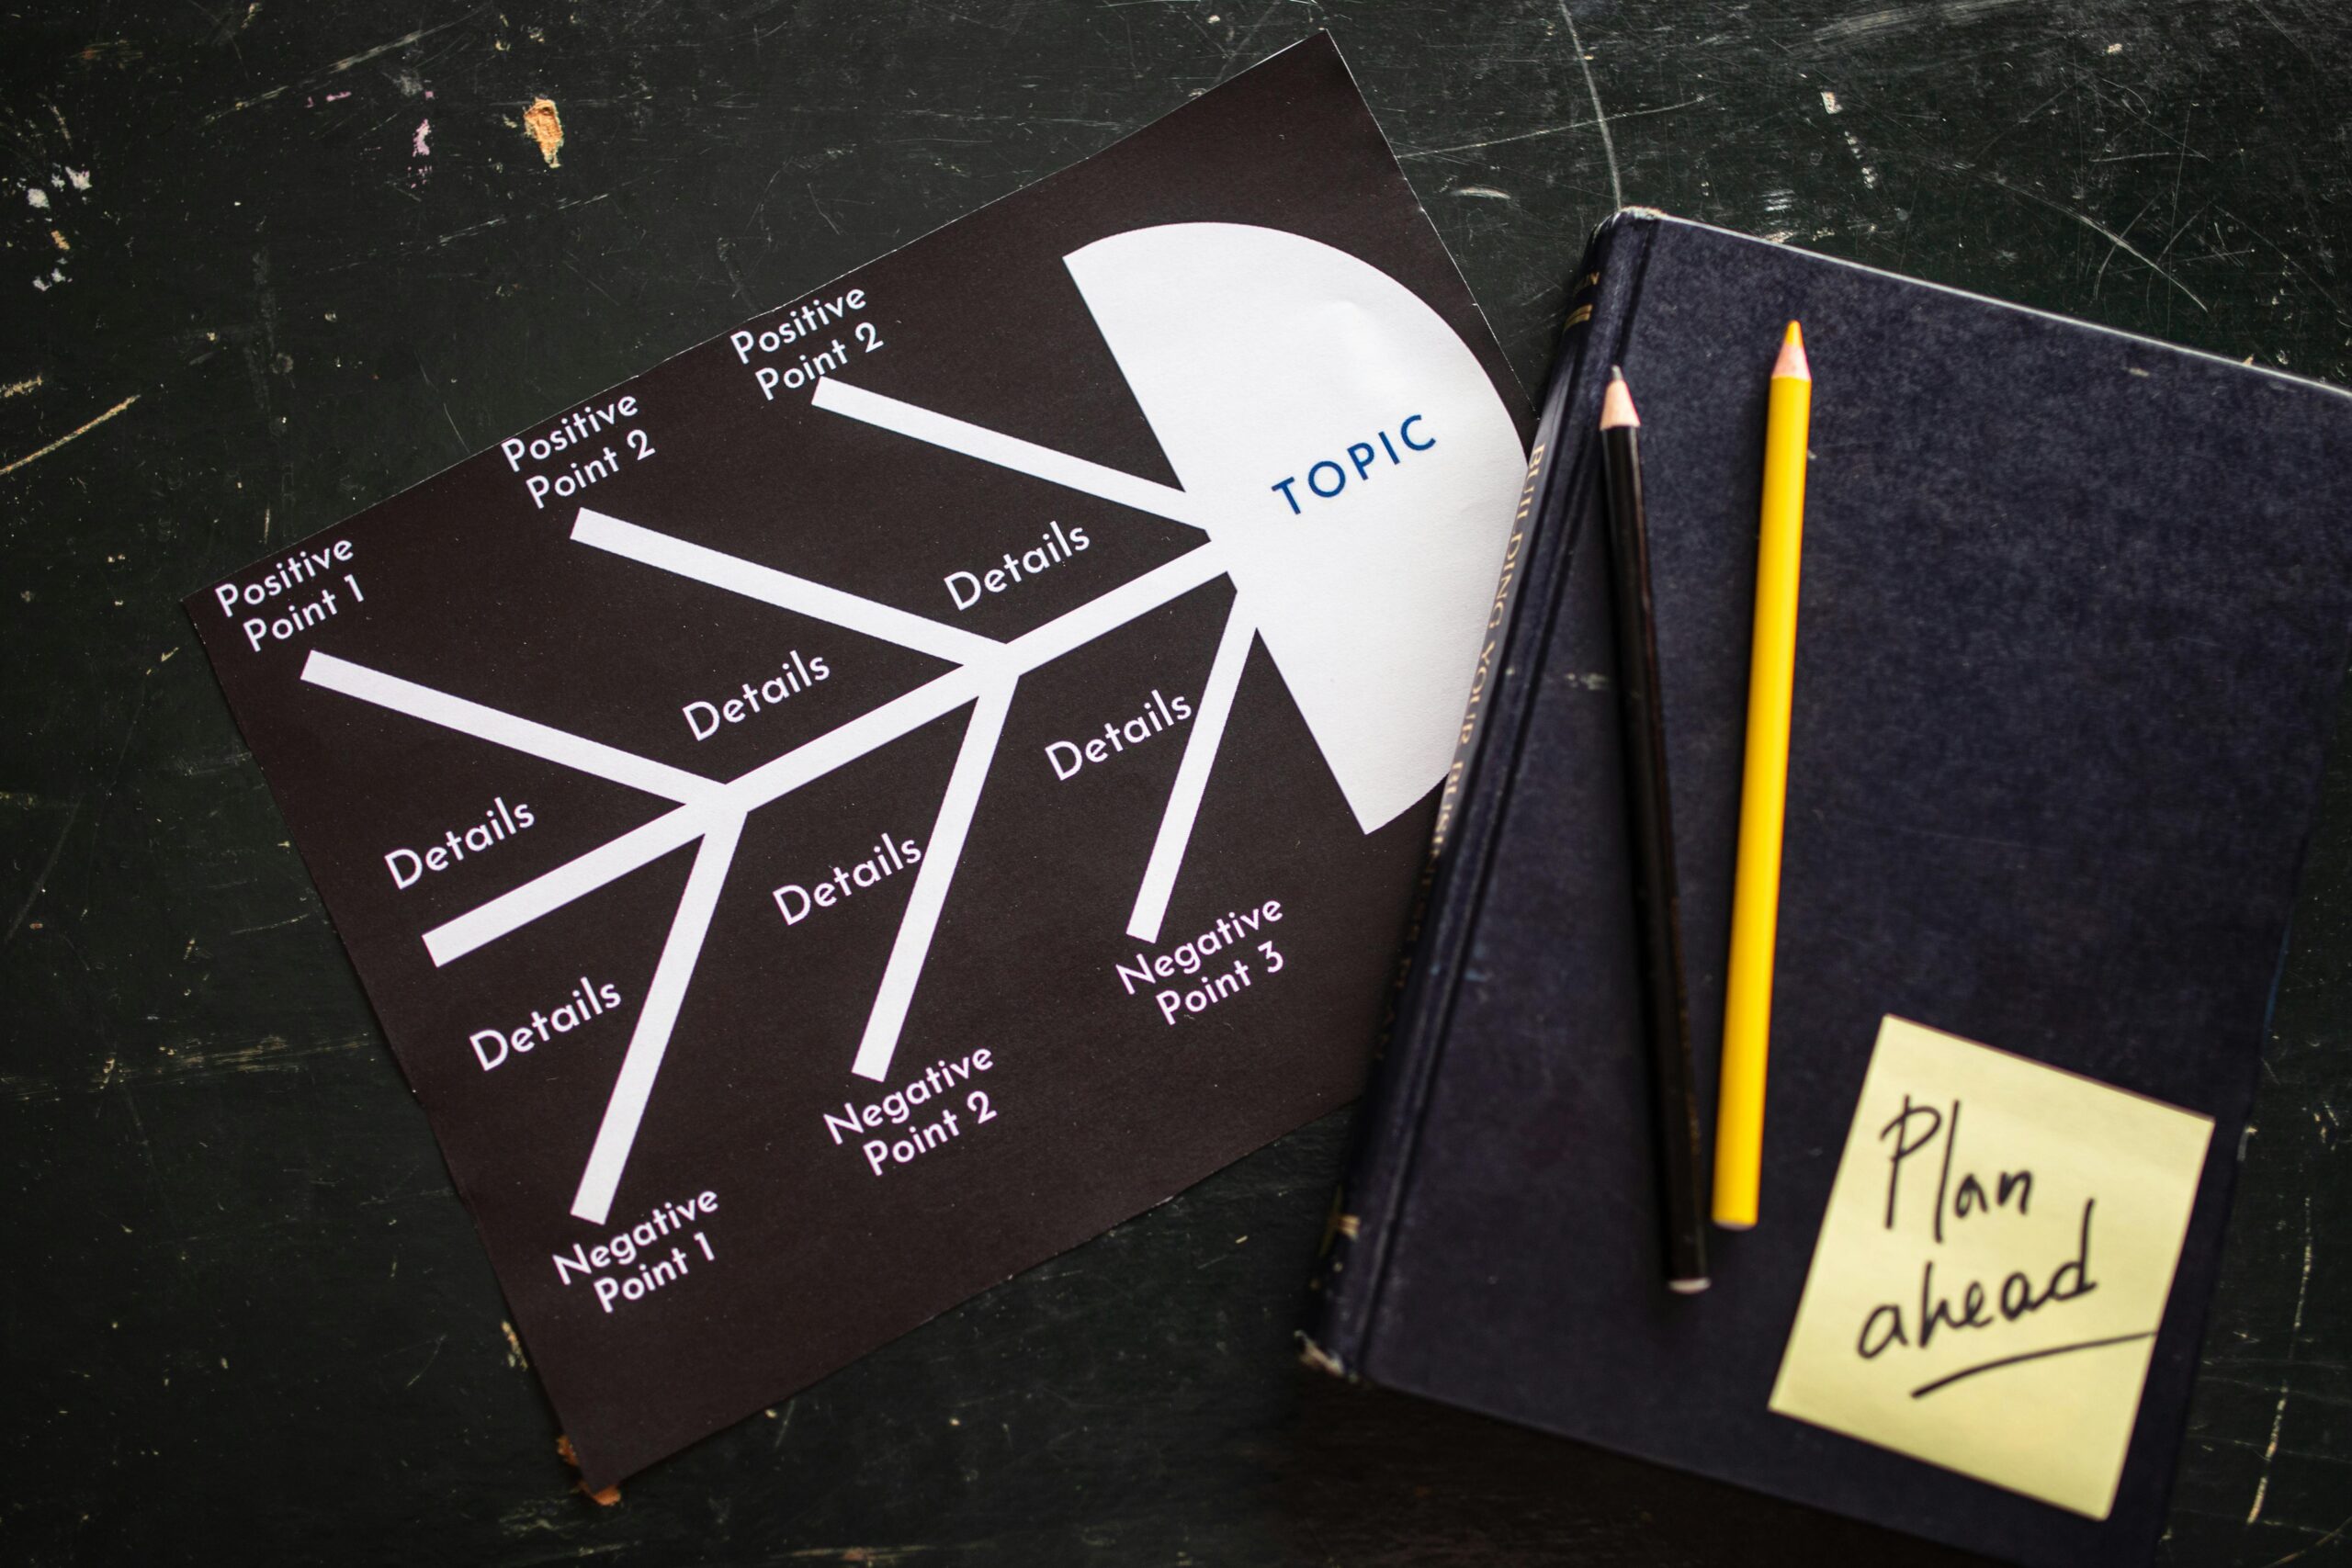
Concept Mapping: Understanding Complex Relationships
Concept maps differ from mind maps by showing more specific relationships between ideas through labeled connecting lines. Rather than a radial structure, concept maps can flow in any direction, making them ideal for mapping cause-and-effect relationships, scientific processes, or organizational structures.
These maps excel when you need to understand how multiple factors interact within a system. For example, when analyzing business challenges, a concept map can clearly illustrate how various departments, resources, and external factors influence each other.
Sketchnoting: Combining Words and Images
Sketchnoting, or visual note-taking, blends text, drawings, typography, and visual elements to capture information during lectures, meetings, or reading sessions. This technique doesn’t require artistic skills—simple symbols, stick figures, and basic shapes suffice to create engaging visual notes.
The act of translating verbal or written information into visual representations forces deeper processing and understanding. Additionally, sketchnotes are far more memorable and enjoyable to review than conventional notes, making them excellent for learning and retention.
Flowcharts and Process Diagrams
When dealing with sequential processes, decision trees, or workflows, flowcharts provide clarity that other visual formats cannot match. These diagrams use standardized shapes to represent different types of steps, decisions, and outcomes, creating a universal visual language understood across industries and cultures.
Flowcharts prove invaluable for troubleshooting problems, designing systems, documenting procedures, and training team members. They transform abstract processes into concrete, easily followed visual guides.
💡 Practical Applications: Where Visual Thinking Shines
Visual thinking tools aren’t just theoretical concepts—they deliver tangible benefits across numerous real-world applications. Understanding where and how to apply these methods maximizes their impact on your productivity and problem-solving capabilities.
Project Planning and Management
Complex projects involve multiple interconnected tasks, deadlines, resources, and stakeholders. Mind maps excel at capturing all project elements in a single visual overview, making it easy to spot dependencies, identify potential bottlenecks, and communicate plans to team members.
Start with the project goal at the center, then branch out into major phases, deliverables, responsibilities, and resources. This visual approach ensures nothing falls through the cracks while keeping the big picture always visible.
Creative Brainstorming and Idea Generation
When you need fresh ideas, visual thinking tools remove the constraints of linear thinking that often limit creativity. Begin with your challenge or opportunity at the center of a mind map, then let ideas flow freely without judgment or organization.
The visual format encourages wild associations and unexpected connections that often lead to breakthrough innovations. Once the initial brainstorm is complete, you can reorganize and refine ideas, grouping related concepts and identifying the most promising directions to explore.
Learning and Knowledge Retention ✏️
Students and lifelong learners find visual thinking tools transformative for mastering new subjects. Creating a mind map while reading a textbook chapter or watching a lecture forces active engagement with the material rather than passive consumption.
The visual structure also makes review sessions more efficient and effective. Rather than re-reading pages of notes, you can quickly scan a mind map to refresh your memory and identify areas needing further study. The spatial layout and visual elements trigger memory retrieval more effectively than linear text.
Problem-Solving and Decision-Making
When facing complex problems or important decisions, visual thinking tools help organize information, identify root causes, and evaluate options systematically. Start by mapping out the problem situation, including all relevant factors, constraints, and stakeholders.
Then branch into potential solutions, exploring the pros, cons, and implications of each option. This comprehensive visual analysis often reveals considerations that might be overlooked in purely verbal discussions, leading to better-informed decisions.
🚀 Boosting Productivity Through Visual Organization
Beyond creative and analytical applications, visual thinking tools significantly enhance day-to-day productivity by improving information organization, task management, and time allocation.
Visual Task Management
Traditional to-do lists can become overwhelming when they grow long and complex. Visual approaches like Kanban boards organize tasks into columns representing different stages (such as “To Do,” “In Progress,” and “Completed”), providing immediate visual feedback on your workflow and progress.
This spatial organization makes it easier to prioritize tasks, identify workload balance, and feel accomplished as you visually move items toward completion. Many digital tools combine mind mapping with task management features, creating powerful productivity ecosystems.
Meeting Notes and Action Items
Meetings often generate scattered information—updates, decisions, action items, and random ideas. Capturing this in a mind map during the meeting creates a structured record that’s immediately useful and easy to share.
Place the meeting topic at the center, with branches for each agenda item, discussion point, or speaker. As action items emerge, clearly mark them with symbols or colors so they’re instantly visible. This visual record eliminates confusion about what was decided and who’s responsible for what.
🔧 Developing Your Visual Thinking Skills: Practical Tips
Like any skill, visual thinking improves with practice and intention. Whether you’re new to these methods or looking to deepen your capabilities, these strategies will accelerate your development.
Start Simple and Build Gradually
Don’t feel pressured to create elaborate, artistic visual masterpieces from the start. Begin with basic mind maps using just keywords and simple branches. As you grow comfortable with the structure, gradually incorporate colors, images, and more complex hierarchies.
The goal isn’t artistic perfection but functional clarity. Even the simplest visual representation typically outperforms purely linear alternatives for most thinking tasks.
Experiment With Different Tools and Styles
Everyone’s brain works differently, so the visual thinking approach that works brilliantly for one person might feel awkward for another. Try various tools—both digital and analog—and different visual formats to discover what resonates with your natural thinking style.
Some people prefer the flexibility of hand-drawn mind maps, while others appreciate the clean organization of digital tools. Some thrive with colorful, image-rich maps, while others prefer minimalist text-based approaches. There’s no single “right” way—find what works for you.
Use Templates to Accelerate Creation
Most digital mind mapping tools offer templates for common use cases like project planning, SWOT analysis, or meeting notes. These pre-built structures provide helpful starting points, especially when you’re new to visual thinking or working on familiar types of tasks.
As you gain experience, you’ll develop your own template library for recurring activities, making it even faster to capture and organize information visually.
Integrate Visual Thinking Into Your Daily Routine
Visual thinking skills develop most effectively through consistent practice. Challenge yourself to use mind maps or other visual tools daily, even for small tasks like planning your day, organizing shopping lists, or working through personal decisions.
This regular practice makes visual thinking increasingly natural and automatic, eventually becoming your default mode for processing information rather than something you consciously choose to do.
🌟 Overcoming Common Obstacles and Misconceptions
Despite the proven benefits of visual thinking tools, some people hesitate to adopt these methods due to misconceptions or initial difficulties. Understanding and addressing these barriers ensures you can fully embrace visual thinking’s potential.
“I’m Not Creative Enough”
Perhaps the most common objection to visual thinking is the belief that it requires artistic ability or creativity. This misconception prevents many logical, analytical individuals from trying methods that would actually enhance their strengths.
Visual thinking isn’t about creating art—it’s about organizing information spatially rather than linearly. You don’t need drawing skills to benefit from mind maps, concept maps, or flowcharts. Simple text and basic shapes are often more effective than elaborate illustrations because they convey information clearly without distraction.
“It Takes Too Much Time”
Some people resist visual thinking because creating a mind map seems slower than quickly jotting linear notes. However, this perspective focuses only on the initial capture time while ignoring the time saved during review, analysis, and application.
A well-constructed mind map dramatically reduces the time needed to understand, remember, and use information. The small upfront investment in visual organization yields substantial downstream time savings and better outcomes.
“My Work Doesn’t Suit Visual Methods”
Occasionally, people in highly technical or specialized fields assume visual thinking applies only to creative or business contexts. In reality, visual methods benefit virtually every domain—from software development to scientific research to legal analysis.
The key is adapting visual tools to your specific needs rather than following generic templates. A programmer might mind map software architecture, a lawyer might visually organize case precedents, and a scientist might concept map experimental variables and relationships.
🎯 Measuring Success: How to Know Visual Thinking Is Working
As you incorporate visual thinking tools into your work and learning, track specific indicators to gauge their impact and refine your approach over time.
Notice whether you can recall information more easily without referring back to notes. Effective visual organization should enhance memory retention significantly. Similarly, observe if you’re generating more creative solutions to problems or making connections between ideas that previously seemed unrelated.
Productivity metrics matter too—are you completing projects faster, with fewer revisions and misunderstandings? Do team members grasp plans and concepts more quickly when presented visually? These practical outcomes demonstrate the real-world value of visual thinking.
Perhaps most importantly, pay attention to your subjective experience. Do you feel less overwhelmed by complex information? Is brainstorming more energizing and productive? Do you approach problems with greater confidence? These qualitative improvements often precede measurable productivity gains and indicate you’re developing powerful cognitive capabilities.
🌐 Visual Thinking in the Digital Age: Future Trends
As technology evolves, visual thinking tools continue advancing with new capabilities that further enhance their power and accessibility. Artificial intelligence increasingly supports visual thinking by suggesting connections, auto-organizing information, and generating visual summaries from text.
Collaborative features are becoming more sophisticated, enabling real-time co-creation of mind maps and visual diagrams by distributed teams. Virtual and augmented reality technologies promise immersive visual thinking environments where you can literally walk through your ideas in three-dimensional space.
Despite these technological advances, the fundamental principles remain constant—visual thinking works because it aligns with how our brains naturally process and connect information. Whether using cutting-edge apps or simple pen and paper, adopting visual thinking methods unlocks cognitive capabilities that transform how you learn, create, solve problems, and achieve your goals.
The journey from linear to visual thinking represents more than just a change in note-taking technique—it’s a fundamental shift in how you engage with information and ideas. By embracing mind mapping and visual thinking tools, you’re not just adopting new productivity tactics; you’re developing enhanced ways of thinking that will serve you across all areas of life. Start small, practice consistently, and watch as visual thinking becomes your most valuable cognitive skill for navigating our increasingly complex world.